Show Details Count feature (see Show Details Count), has been renamed to Show Additional Info
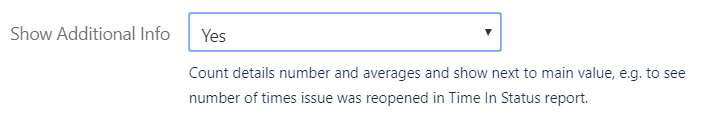
Now, there is, additionally, Average displayed below details count. It is calculated as value divided by number of unique objects (work entry, issue, user, etc) used in sum. Total row is calculated as total divided by number of issuesTotal column calculates as time divided by number of unique columns included in row. So total for WWW-4 row is 1d 1h / 2 (Done, To Do) = 4h 30m
The sample averages can be Average Time issues spend In Status, or Average Time User works per issue type.
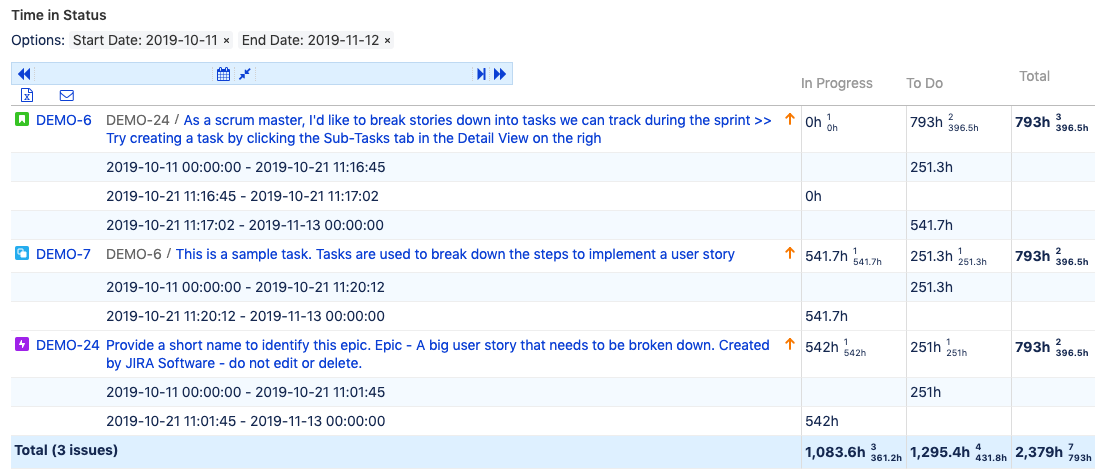
Here in example above, in Total row, we can see it takes 361.2h to resolve an issue (In Progress column), and 431.8h till work is started on an issue (To Do column). Note, total for To Do is sum of 4 entries, but has only 3 unique issues, so average is 1,295.4h / 3 = 431.8h.
Average in Total column shows how long issue is in a status in average, and is calculated as total divided by number of non empty cells in row.
It is now possible to restrict to Log Work more than 1d, see Restrict Working Hours Per Day setting in app configuration, General tab.
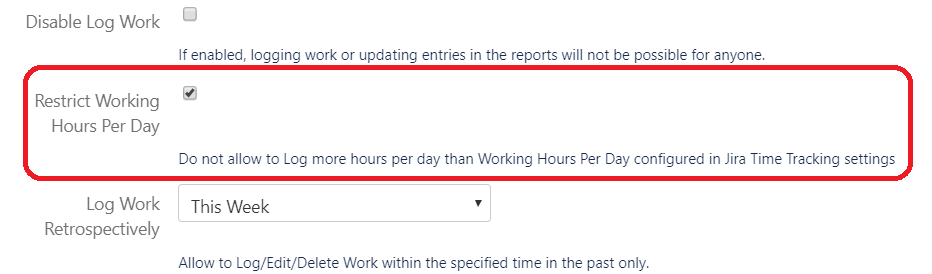
It blocks logging more, than Working Hours Per Day for particular day and particular user, as configured in Jira Time Tracking settings. All logs calculated, so it is not possible to log more than 1d in several issues.
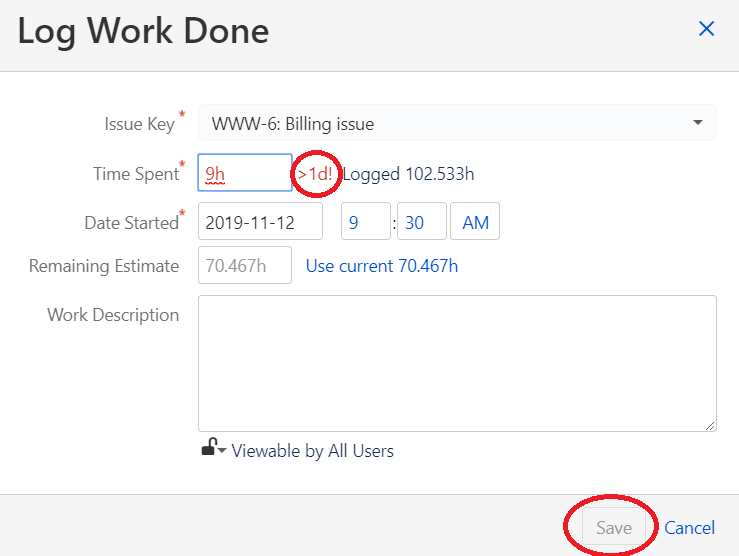
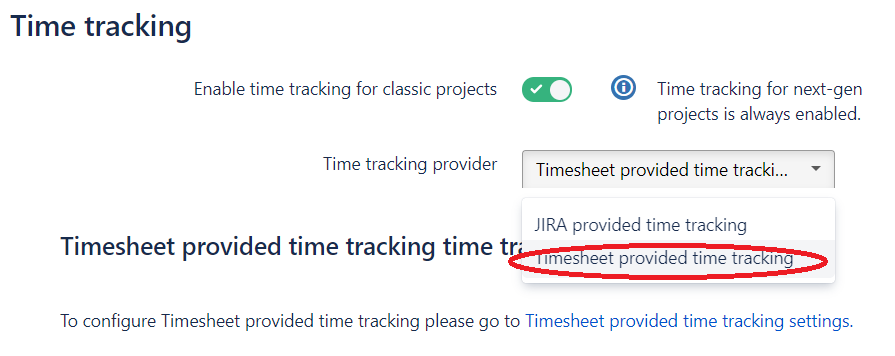
Please note, it will still be possible to log any hours for any issue using Jira native Log Work dialog, unless Timesheet/Time Reports provided time tracking is configured in Jira Settings - Issues - Time Tracking - Time Tracking provider.